Basic Enzyme Kinetics
Enzyme Kinetics
Enzymes play a crucial role in biological processes and are regulated by enhancing or reducing their activity. There are many different kinds of molecules (e.g., drugs) that inhibit enzyme function and various mechanisms exist for enzyme inhibition. Enzyme inhibition is a reduction in the rate of an enzyme-catalysed reaction by substances called inhibitors. The effects of many drugs are produced as enzyme inhibitors. The determination of enzyme kinetic parameters such as Vmax, Km, and Ki are important for the estimation of many biochemical reactions. These include the detection of metabolic control points, intracellular reaction rates, isoenzymes from different tissues, molecular catalysis, and the potency of inhibitors. Enzyme kinetic data is best analyzed by computerized nonlinear least-squares curve-fitting techniques.
Basic considerations in fitting enzyme reactions to models
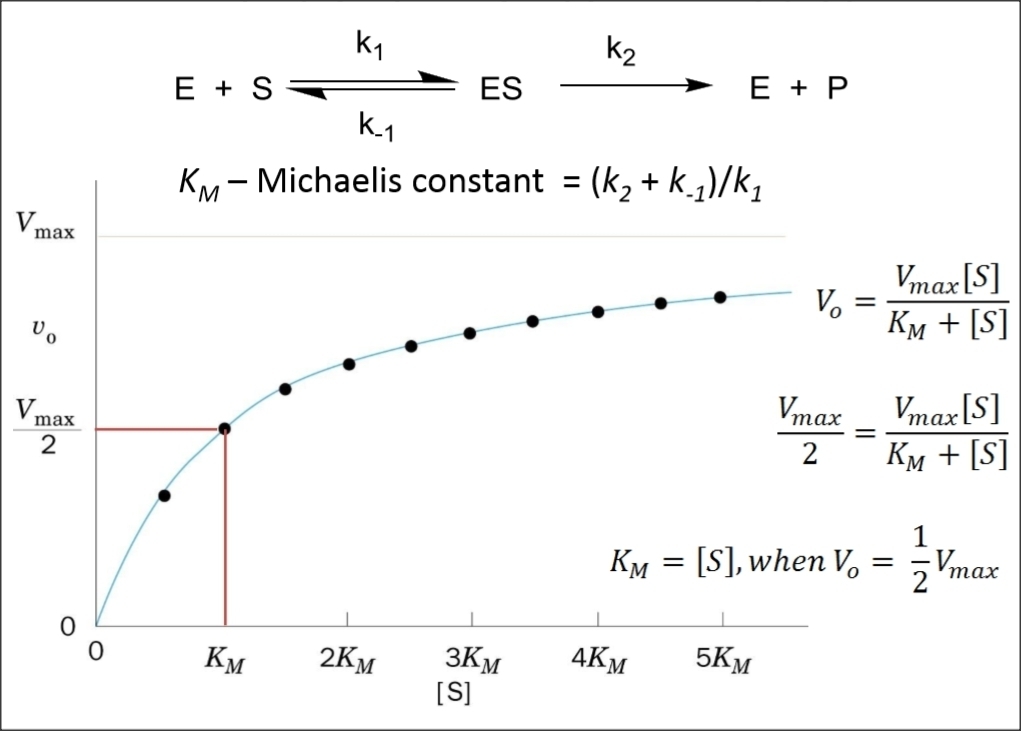
The initial velocity of an enzyme catalyzed reaction is related to the substrate concentration by the Michaelis-Menten equation, v = (Vmax*S)/(Km+S). The Km and Vmax parameters define the rectangular hyperbola relating v to S. Three assumptions are immportant when deriving this equation,
- the velocity measurement is determined when the concentration of enzyme-substrate complex is not changing,
- the concentration of enzyme-substrate complex does not significantly deplete the concentration of substrate,
- the rate of the reverse reaction is negligible.
To measure the initial rate of an enzymatic reaction, the amount of substrate (and coenzyme if needed) must be in excess of the enzyme concentration to ensure that no more than 20% of the available substrate is converted to product. Then the amount of substrate or product formed, will depend only on the amount of enzyme present to catalyze the reaction (i.e., zero-order kinetics). Moreover, there should not be inhibitors present or other substances that may influence the rate of the reaction, and the pH and temperature should be maintained throughout the assay at which the enzyme is active (typically pH 7 to 8 and 25 to 37 oC). When the enzyme is initially introduced to the assay, the excess substrate is steadily combining with free enzyme and the reaction rate increases. When the enzyme becomes saturated with substrate, the rate of product formation, release of free enzyme, and recombining with more substrate proceeds linearly. After this period of time, the reaction rate decreases as the substrate is depleted and the product begins to inhibit the reaction. The reverse reaction may also occur.
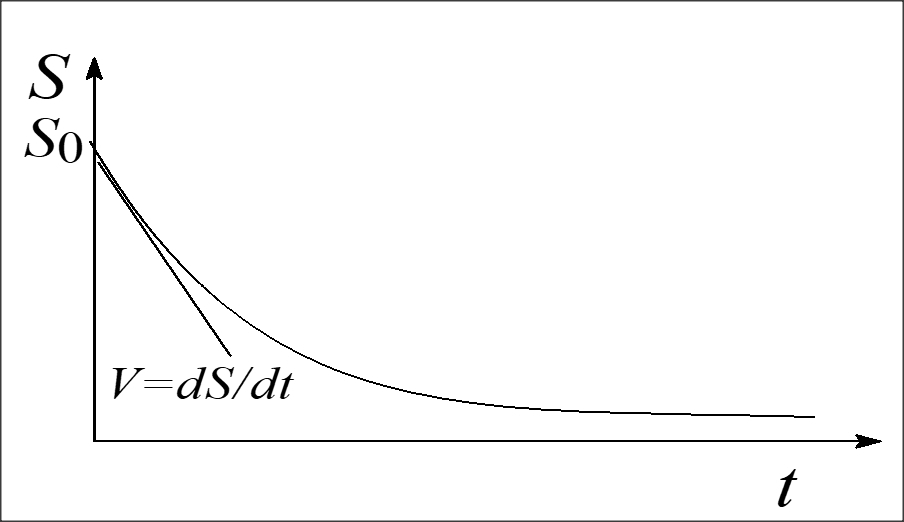
Initial velocity measurements are approximated at the linear portion of the curve, representing a zero order reaction. This is the portion of the [S]t versus time curve in which the rate is constant with time. As substrate is used up, the enzyme's active sites are no longer saturated, the substrate concentration becomes rate limiting, and then the reaction becomes first order (curved portion). To measure enzyme initial rate of reaction (e.g., velocity or activity) accurately, the measurements of substrate depletion or product formation must be made in the portion of the curve where the reaction is zero order. A reaction is most likely to be zero order at the initially start of the reaction since substrate concentration is greatest. To ensure that a reaction is zero order, multiple measurements of substrate (or product) concentration should be made.
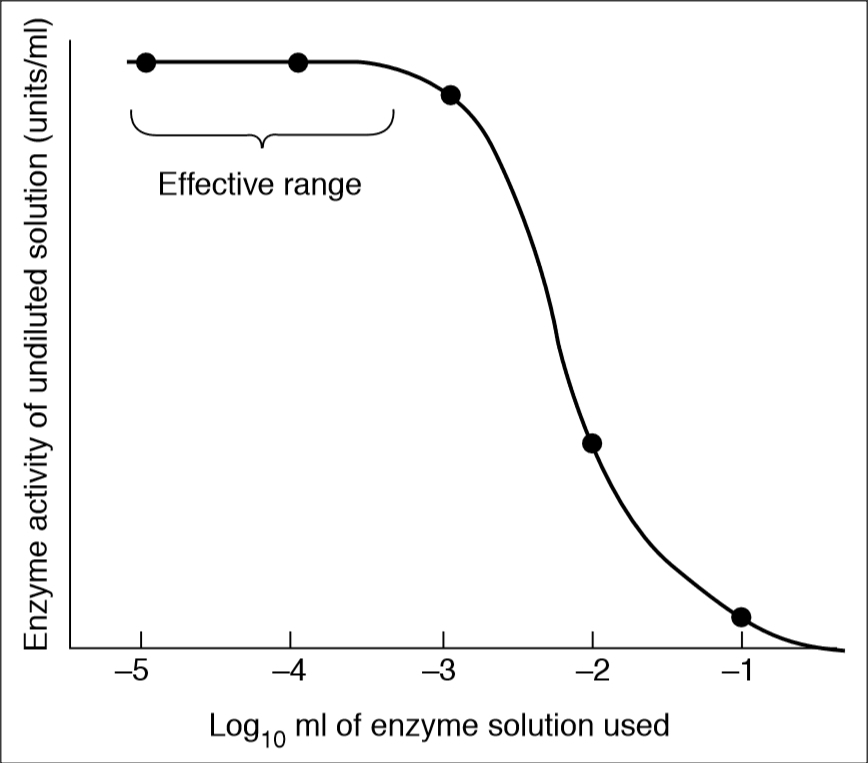
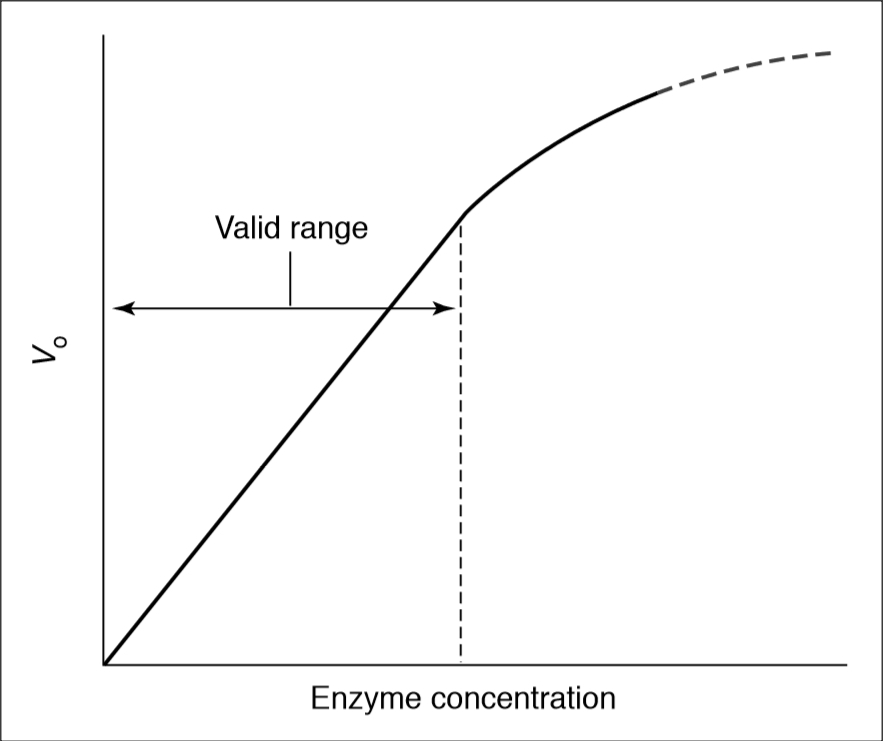
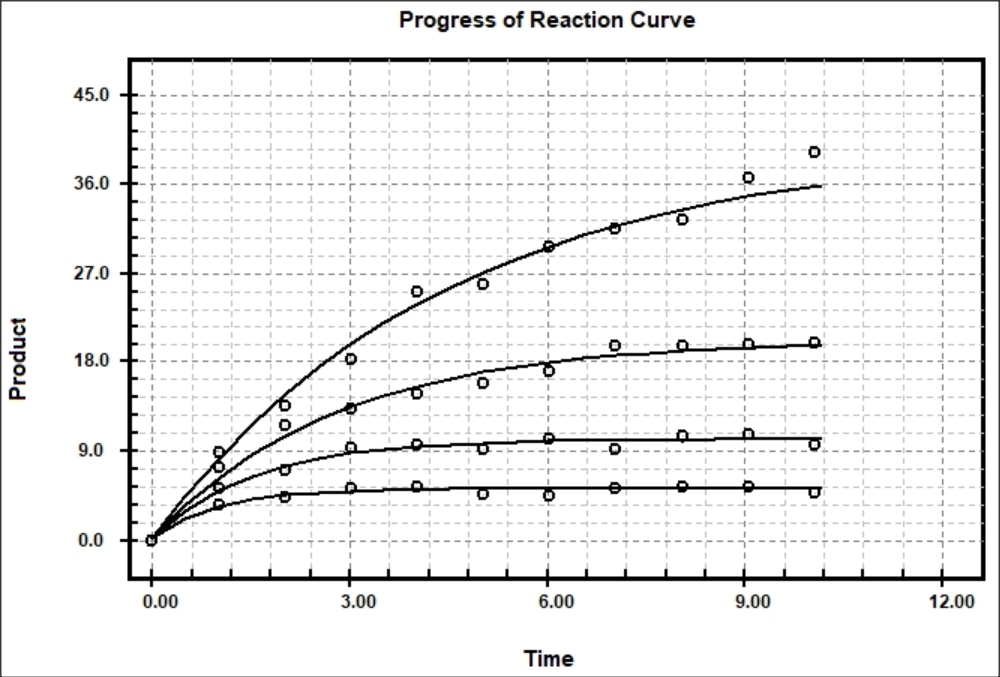
When enzyme assays are based on a single measurement at a defined time, it may not be possible to predict the appropriate amount of enzyme to use in fixed-time assays to achieve the optimum velocity. However, this can be empirically determined by dilutions experiment. First, constant volumes of serial 10-fold dilutions of enzyme are assayed to locate the range of dilution in which the calculated activity is maximal (i.e., optimal enzyme concentration for assay). Second, test of the validity of initial velocity assays by determining that the rates observed are a linear function of enzyme concentration. These tests should be applied to all assays in which reaction rates are used to measure enzyme kinetics. BestCurvFit uses Model #18 to globally fit progress curves to estimate initial velocities vo of each curve.
Progress of Enzyme Reaction ([s] vs time)
Enzyme Dilution, and Rate vs [Enzyme]
Progress Curves of Enzyme Reaction Michaelis-Menten Kinetics
Types of Enzyme Inhibition Kinetics
Inhibitors can be categorized into four mechanistic types:
competitive, uncompetitive, noncompetitive, and mixed noncompetitive.
- Competitive inhibition occurs when the inhibitor molecules resemble the substrate molecules and bind to the active site of the enzyme. In this way they prevent the normal activity of the enzyme. Competitive type inhibition can be reversed by increasing the concentration of the substrate.
- Uncompetitive inhibition occurs when the inhibitor binds, not to the free enzyme, but to the enzyme-substrate complex only.
- In noncompetitive inhibition the inhibitor binds to a part of the enzyme or enzyme–substrate complex other than the active site. This deforms the active site so that the enzyme cannot catalyse the normal reaction. Noncompetitive inhibition cannot be reversed by increasing the concentration of the substrate.
- Mixed type inhibition is similar to noncompetitive inhibition except that the binding of the substrate or inhibitor to the enzyme affects the binding of the other.
- Partial inhibition is a variant of the above inhibition types. In this type, the inhibitor only parially prevents the substrate from binding to the enzyme active site and therefore is unable to completely prevent product from being produced. In other words, the inhibitor-substrate-enzyme complex is partially active, and still binds and transforms the substrate although at a lower catalytic rate.
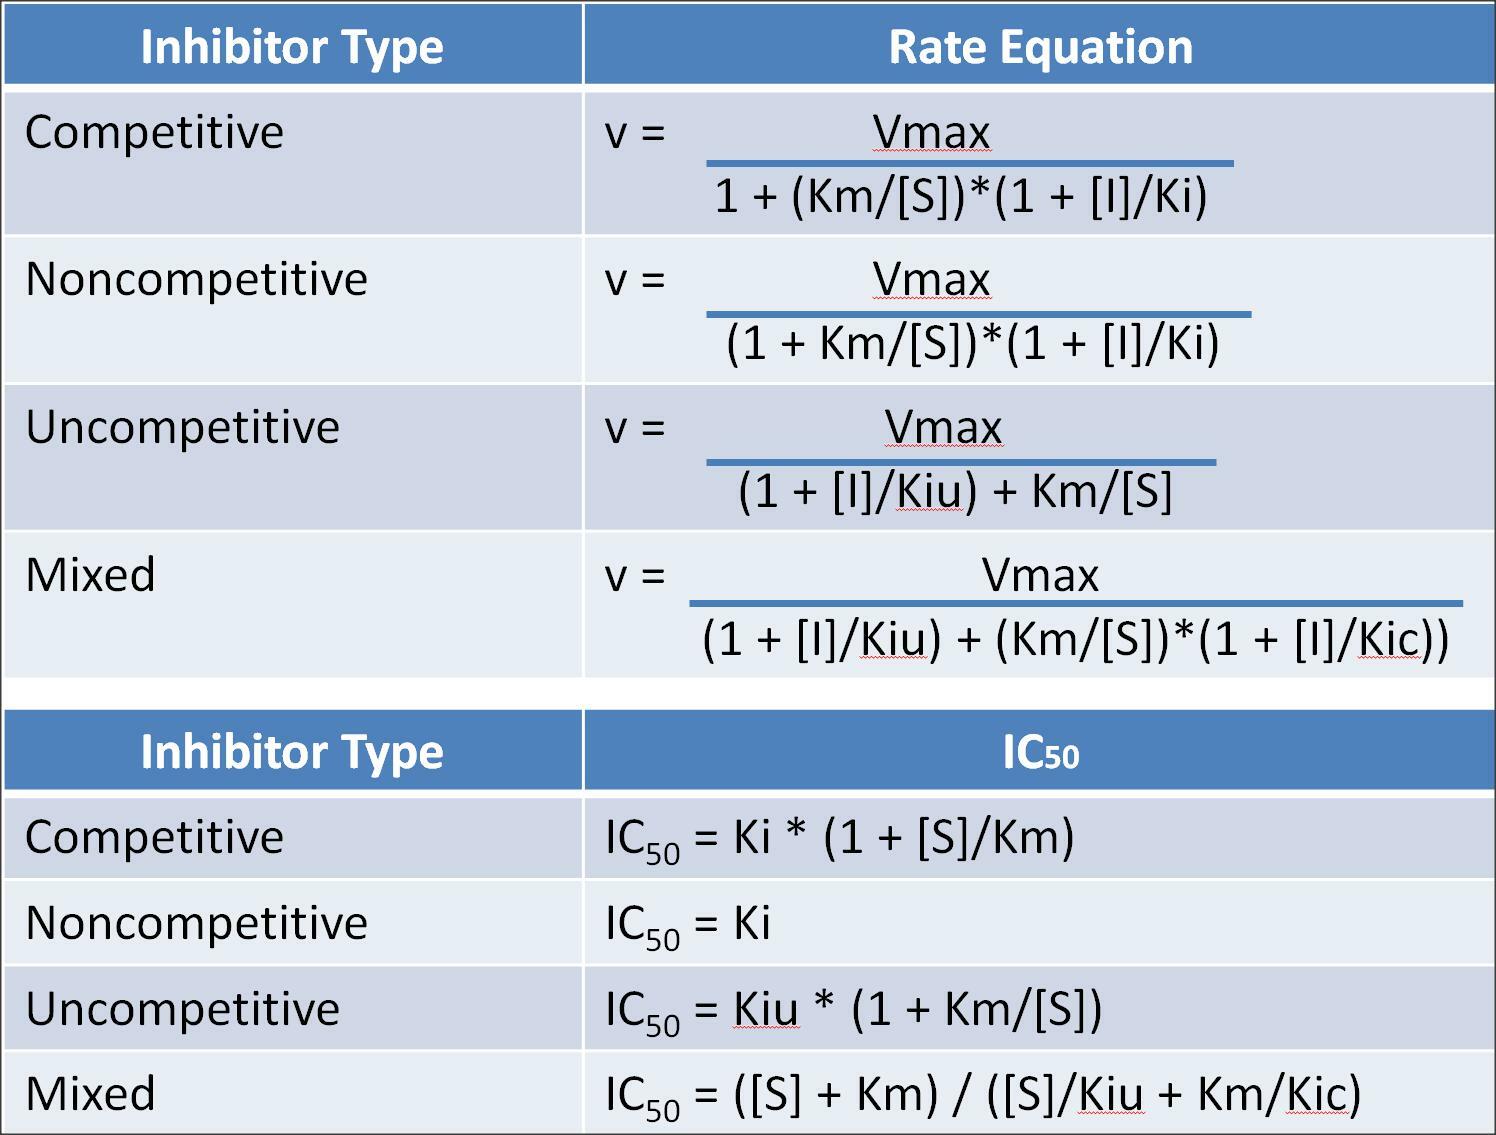
The equations used for the basic types of enzyme inhibition are shown below. However, some practitioners prefer to use IC50 values (inhibitory concentration that decreases the activity by 50%) in place of inhibitory constants, Ki's. The formulas for the conversion of Ki to IC50 for the basic types of enzyme inhibition are shown below.
For a more detailed explanation of enzyme-modifier mechanisms see the Website of Professor Antonio Baici, retired professor of Biochemistry at the University of Zurich, at 'Kinetic Mechanisms of Enzyme Inhibition and Activation'. https://www.enzyme-modifier.ch/a-word-on-software/

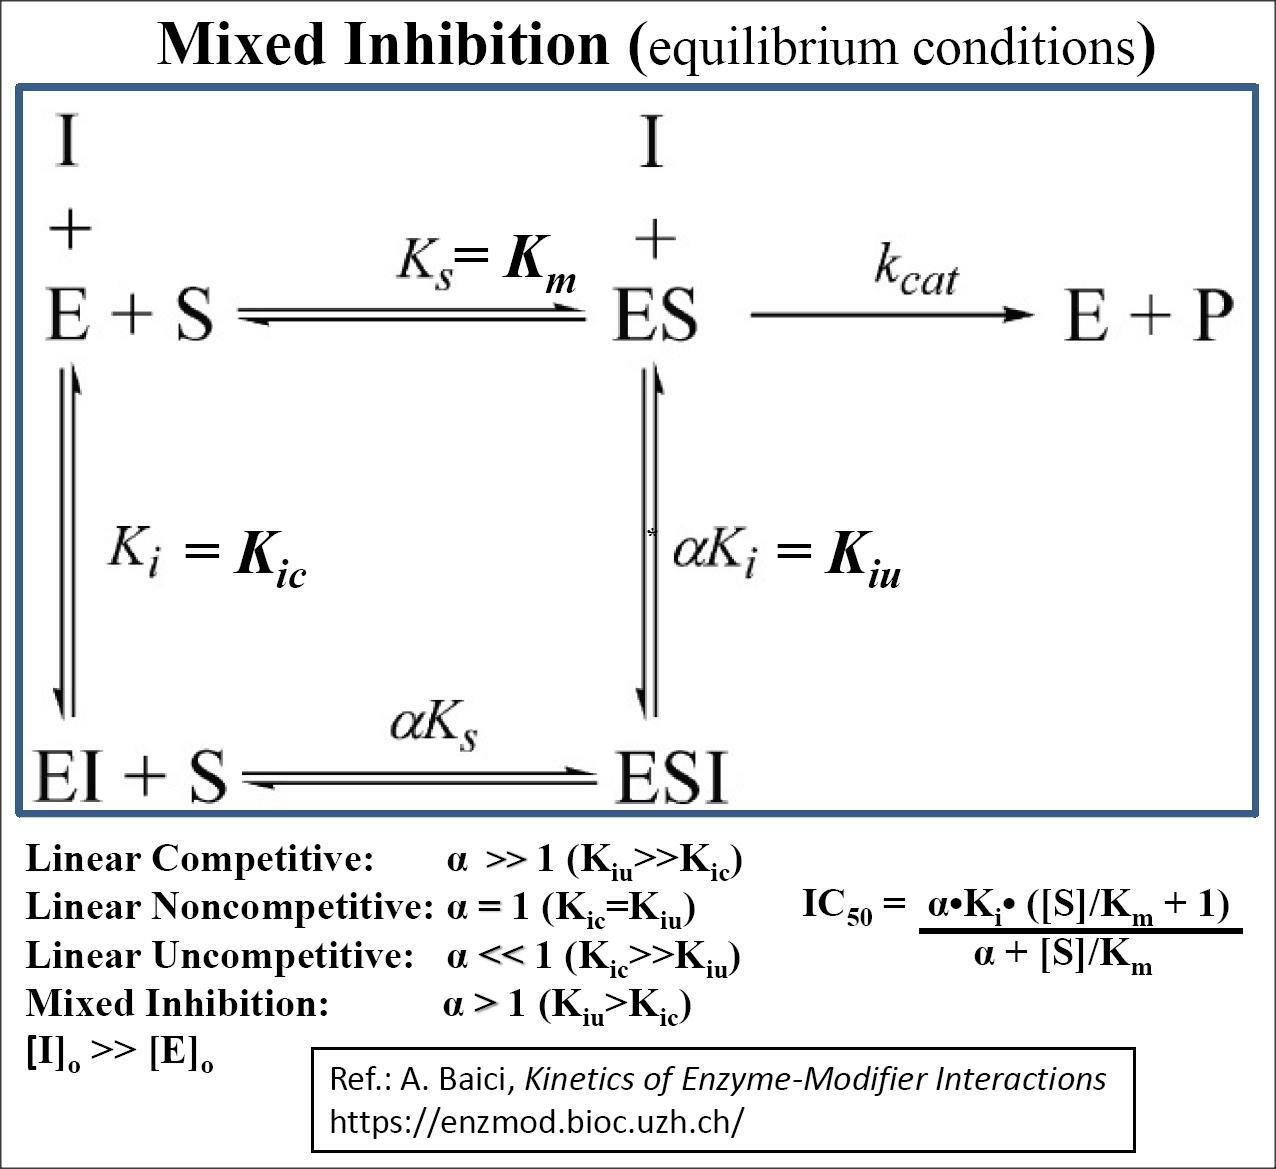
For a detailed explanation of the Kinetivs of Enzyme-Modifier Interactions, See A. Baici's Website below:
Useful Criteria to Distinguish Among Enzyme Kinetic Models
- A model for which the regression converges but fails to converge for another model, should be accepted over the later model.
- A model for which the parameter values (i.e., Km, Vmax, Ki) produced by the curve-fit give small standard errors, should be accepted over a model that produces very large standard errors of parameter values.
- Models which produce residuals deviations (difference between fitted curve and experimental data) that are relatively small, should be accepted over a model that produces large non-random deviations from the fitted curve.
- Models which produce the smallest Model Information Criterion (MIC) values should be accepted over a models that produce much larger MIC values.
- Models that produce parameter values with standard errors greater than 25%, even if the model may be correct, may have too large a variability of the velocity measurements. Increasing the number of data points may increase the precision of the velocity measurements.
- The distribution of substrate concentrations should be broad enough to span both below and above the Km value. Similarly, the inhibitors should be used at concentrations that may affect both the Km and the Vmax values.
- When an individual data point is inconsistent with the pattern of the majority of points, such an aberrant point may be considered an outlier. At times, outliers can have a large effect on the parameters and their standard errors. One way of eliminating outliers is to reject them when they are at least two or three standard deviations from the best fitted curve.
- Lastly, velocity measurement errors that arise from experimental protocol or poor technique, pipetting errors, poorly calibrated equipment, enzyme or substrate instability, or by day to day variability should be reduced as much as is practical or if possible eliminated.
Multicollinearity of Regression Variables
When performing nonlinear regression of data to mathematical models, some explanatory variables may be intercorrelated and produce significant effects on each another. This relationship can compromises the results of multivariable regression analyses. The intercorrelation between explanatory variables is called “multicollinearity.” Multicollinearity represents a high degree of linear intercorrelation between explanatory variables in a regression model and may lead to incorrect results of the regression analyses. The condition index and variance decomposition proportion (VDP) can be used as a diagnostic tool to detect multicollinearity. Eigenvectors derived from eigenvalues are used to calculate the VDPs, and represent the extent of variance inflation by multicollinearity. This allows the determination of the variables involved in the multicollinearity. Each explanatory variable has VDP corresponding to each condition index. When two or more VDPs, which correspond to a common condition index higher than 30, are higher than 0.30, their associated explanatory variables are considered multicollinear and indicate near-linear dependence. Multicollinearity can inflate the variances of the explanatory variables, making the coefficients statistically insignificant and widen their confidence intervals. Excluding multicollinear explanatory variables is a way to improve the stability of regression models. BestCurvFit uses the condition index and VDP to detect multicollinearity of explanatory variable in its results.
Why the Curve-Fit May Not Converge?
In some cases the curve-fit procedure may fail to find the optimal parameters values. The actual mathematical reason for this error might be the failure to invert the matrix calculated from partial derivatives of the fit function with respect to fit parameters. This inverted matrix is used to compute the new values of parameters for next step of the curve-fit. In some cases this error occurs when the matrix is ill-conditioned or nearly singular and the inverse cannot be calculated accurately enough using floating- point arithmetic. A possible cause of this error could be that some parameters are taking unrealistically values during curve-fit iterations or that there is no local minimum of residual sum of squares near the initial values of these parameters. Another cause might be that there exists a mutual dependency between some parameters such that the algorithm could not resolve which parameter to vary. Alternatively, an unrealistic parameter value may cause a numeric overflow or underflow when calculating the fit function. When convergence is not successful try the following,
(1) select the "Rerun" option from the main menu,
(2) enter more accurate initial values of parameters, or
(3) mask some parameters to constrain them to a fixed value.
Catalytic Efficiency of an Enzyme
How to calculate the catalytic efficiency (kcat/Km) of an enzyme which has the following values?
Enzyme concentration ([E]) used= 20 µg
Molecular weight of enzyme= 43.23 kDa = 389 amino acids x 111 g/mol = 43.23 x 10^3 g/mol = 43230 g/mol
Reaction volume= 100 µl
Km= 38.43 µM
Vmax= 42 pmol min^-1 mg^-1
Background:
Kcat or catalytic constant k2, also known as the turnover number, is the number of substrate molecules each enzyme active site converts to product per second when the enzyme is saturated with substrate. The greater the Kcat value, the more substrates are turned over to product in one second. The Kcat value does not vary with the concentration of enzyme used in the assay because the concentration of enzyme is taken into account. Since the Kcat is equal to Vmax/[E], it is therefore a constant for an enzyme. However, the rate of product formation is dependent on both how well the enzyme binds substrate and how fast the enzyme converts substrate into product. The catalytic efficiency kcat/Km reflects both binding and catalytic events and indicates how the velocity varies according to how often the enzyme and substrate combine. It is the best value to represent the enzyme’s overall ability to convert substrate to product. The upper limit for kcat/Km is equal to rate of substrate diffusion which is between 10^8 and 10^9 M^−1 sec^−1.
Calculation:
To calculate the catalytic efficiency (kcat/Km, M^-1 sec^-1), first make the following conversions:
Enzyme concentration ([E]) used= 20 ug = 0.02 mg = 20 x 10^-6 g
Molecular weight of enzyme= 43.23 kDa = 43.23 x 10^3 g/mol = 43230 g/mol
Reaction volume= 100 µL
Km= 38.43 µM = 38.43 x 10^-6 M
Vmax (specific activity) = 42 µmol min^-1 mg^-1
Then to convert this Vmax specific activity into velocity units, the Vmax must be multiplied by the amount of enzyme in mg present in the assay:
Vmax = 42 µmol min^-1 mg^-1 x 0.02 mg = 0.84 µmol/min
And as the assay volume is 100 µL, the Vmax becomes 8.4 mM/min as follows:
0.84 µmol/min/100 µL = 0.84 x 10^-6 mol/min/100 µL = 8.4 x 10^-6 mol/min/mL =
8.4 x 10^-6 mol/min/10^3 mL = 8.4 x 10^-3 mol/min/L = 8.4 mmol/min/L = 8.4 mM/min
The concentration of enzyme ([E]) in the assay is calculated by dividing by its molecular weight:
20 x 10^-6 g/100 µL / 43230 g/mole = 4.63 x 10^-4 mol x 10^-6 g/100 x 10^-6 L = 4.63 µmoles/L = 4.63 µM
Then to calculate the kcat, divide the Vmax by the enzyme concentration, kcat = Vmax/[E] as follows:
kcat = 8.4 mM/min / 4.63 µM = 8.4 x 10^3 µM/min / 4.63 µM = 1.81 x 10^3 min^-1 = 1810.0 min^-1
Finally, the catalytic efficiency (kcat/Km) is calculated as follows:
1.81 x 10^3 min^-1 / 38.43 x 10^-6 M = 47.10 x 10^6 M^-1 min^-1 / 60 sec min^-1 = 785,000 M^-1 sec^-1.
Your cart is empty
0
item(s)
/
$0
Checkout
Clear cart